Key Findings for the Dover District
The English Indices of Deprivation 2015 reinforce previously identified patterns of deprivation across the district.
The district continues to have deprivation ‘hot spots’ that are amongst some of the most deprived small areas in the country yet are geographically close to some of the least deprived areas in the country.
When compared with other Local Authorities in Kent and England as a whole, the Dover district is in England’s most deprived half of local authorities.
- National rank: 126 (out of 326 English local authority districts) *
- Kent rank: 5 (out of 12 Kent local authority districts) *
- Number of LSOAs in the most deprived 10% nationally: 04 (out of 67 LSOAs in the district) **
- Number of LSOAs in the most deprived 20% nationally: 11 (out of 67 LSOAs in the district) **
- Number of LSOAs in the least deprived 10% nationally: 01 (out of 67 LSOAs in the district) **
- The highest levels of multiple deprivation are found in the urban areas of Dover
* Where 1 is the most deprived; using the Rank of Average Score
** LSOAs (or Lower-layer Super Output Areas) are small geographical areas with approximately 1,500 residents or 650 households
National Position
The Indices of Deprivation can be summarised in a range of ways to describe relative deprivation among local authorities. Each of these will lead to a different ranking of local authorities. For simplicity and continuity with analysis from previous releases, we have used the Rank of Average Score measure in describing deprivation at a local authority level.
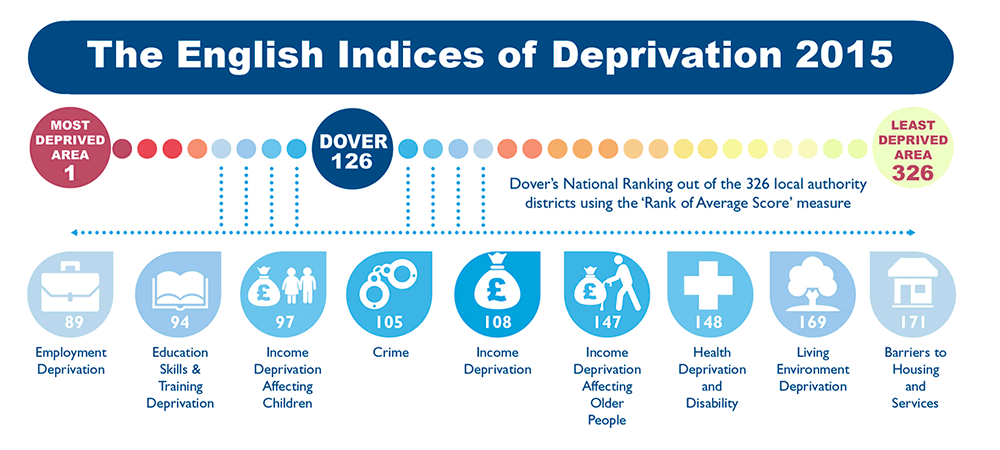
The following infographic summarises the rankings for the Dover district in the Index of Multiple Deprivation and the individual types of deprivation:
 The following papers provide further information on these national rankings.
- Dover District English Indices of Deprivation 2015 Briefing Paper (PDF)
This briefing paper provides further background information to the English Indices of Deprivation, key findings for the district, comparisons and relative change over time.
- Index of Multiple Deprivation 2015 (PDF)
Summary analysis of the overall deprivation index formed from the seven combined types (domains) of deprivation, focusing on the Dover district.
The Dover district ranks 126 out of 326 local authorities in England, where 1 = most deprived, using the Rank of Average Score.
- Income Deprivation Domain (PDF)
Summary of the deprivation index concerned specifically with income deprivation, one of the domains that contributes to the Index of Multiple Deprivation.
The Dover district ranks 108 out of 326 local authorities in England, where 1 = most deprived, using the Rank of Average Score.
- Employment Deprivation Domain (PDF)
Summary of the deprivation index concerned specifically with employment deprivation, one of the domains that contributes to the Index of Multiple Deprivation.
The Dover district ranks 89 out of 326 local authorities in England, where 1 = most deprived, using the Rank of Average Score.
- Education, Skills and Training Deprivation Domain (PDF)
Summary of the deprivation index concerned specifically with education, skills and training deprivation, one of the domains that contributes to the Index of Multiple Deprivation.
The Dover district ranks 94 out of 326 local authorities in England, where 1 = most deprived, using the Rank of Average Score.
- Crime Domain (PDF)
Summary of the deprivation index concerned specifically with crime, one of the domains that contributes to the Index of Multiple Deprivation.
The Dover district ranks 105 out of 326 local authorities in England, where 1 = most deprived, using the Rank of Average Score.
- Living Environment Deprivation Domain (PDF)
Summary of the deprivation index concerned specifically with living environment deprivation, one of the domains that contributes to the Index of Multiple Deprivation.
The Dover district ranks 169 out of 326 local authorities in England, where 1 = most deprived, using the Rank of Average Score.
- Health Deprivation and Disability Domain (PDF)
Summary of the deprivation index concerned specifically with health deprivation and disability, one of the domains that contributes to the Index of Multiple Deprivation.
The Dover district ranks 148 out of 326 local authorities in England, where 1 = most deprived, using the Rank of Average Score.
- Barriers to Housing and Services Domain (PDF)
Summary of the deprivation index concerned specifically with barriers to housing and services, one of the domains that contributes to the Index of Multiple Deprivation.
The Dover district ranks 171 out of 326 local authorities in England, where 1 = most deprived, using the Rank of Average Score.
- Income Deprivation Affecting Children Index (PDF)
Summary of the supplementary index that measures the proportion of children aged 0-15 years living in income-deprived households. This is a sub-model of the income deprivation domain and, as such, does not feed into the overall Index of Multiple Deprivation.
The Dover district ranks 97 out of 326 local authorities in England, where 1 = most deprived, using the Rank of Average Score.
- Income Deprivation Affecting Older People Index (PDF)
Summary of the supplementary index that measures the proportion of people aged 60 years and over living in income-deprived households. This is a sub-model of the income deprivation domain and, as such, does not feed into the overall Index of Multiple Deprivation.
The Dover district ranks 147 out of 326 local authorities in England, where 1 = most deprived, using the Rank of Average Score.
What are the Indices of Deprivation?
Links to further information about the Indices of Deprivation 2015
The English Indices of Deprivation in the Dover district
An economic, social and environmental profile of the district
Information on the district from the Census 2011