How the population changed in the Dover District
Population and household estimates
The Office for National Statistics published the first Census 2021 outputs on 28 June. The population and household estimates include a total of 63 datasets under the headings of:
- Usual resident population by sex
- Usual resident population by five-year age group
- Usual resident population by sex and five-year age group
- Usual resident population density
Please see definitions below for details of these indicators.
Population change between 2011 and 2021
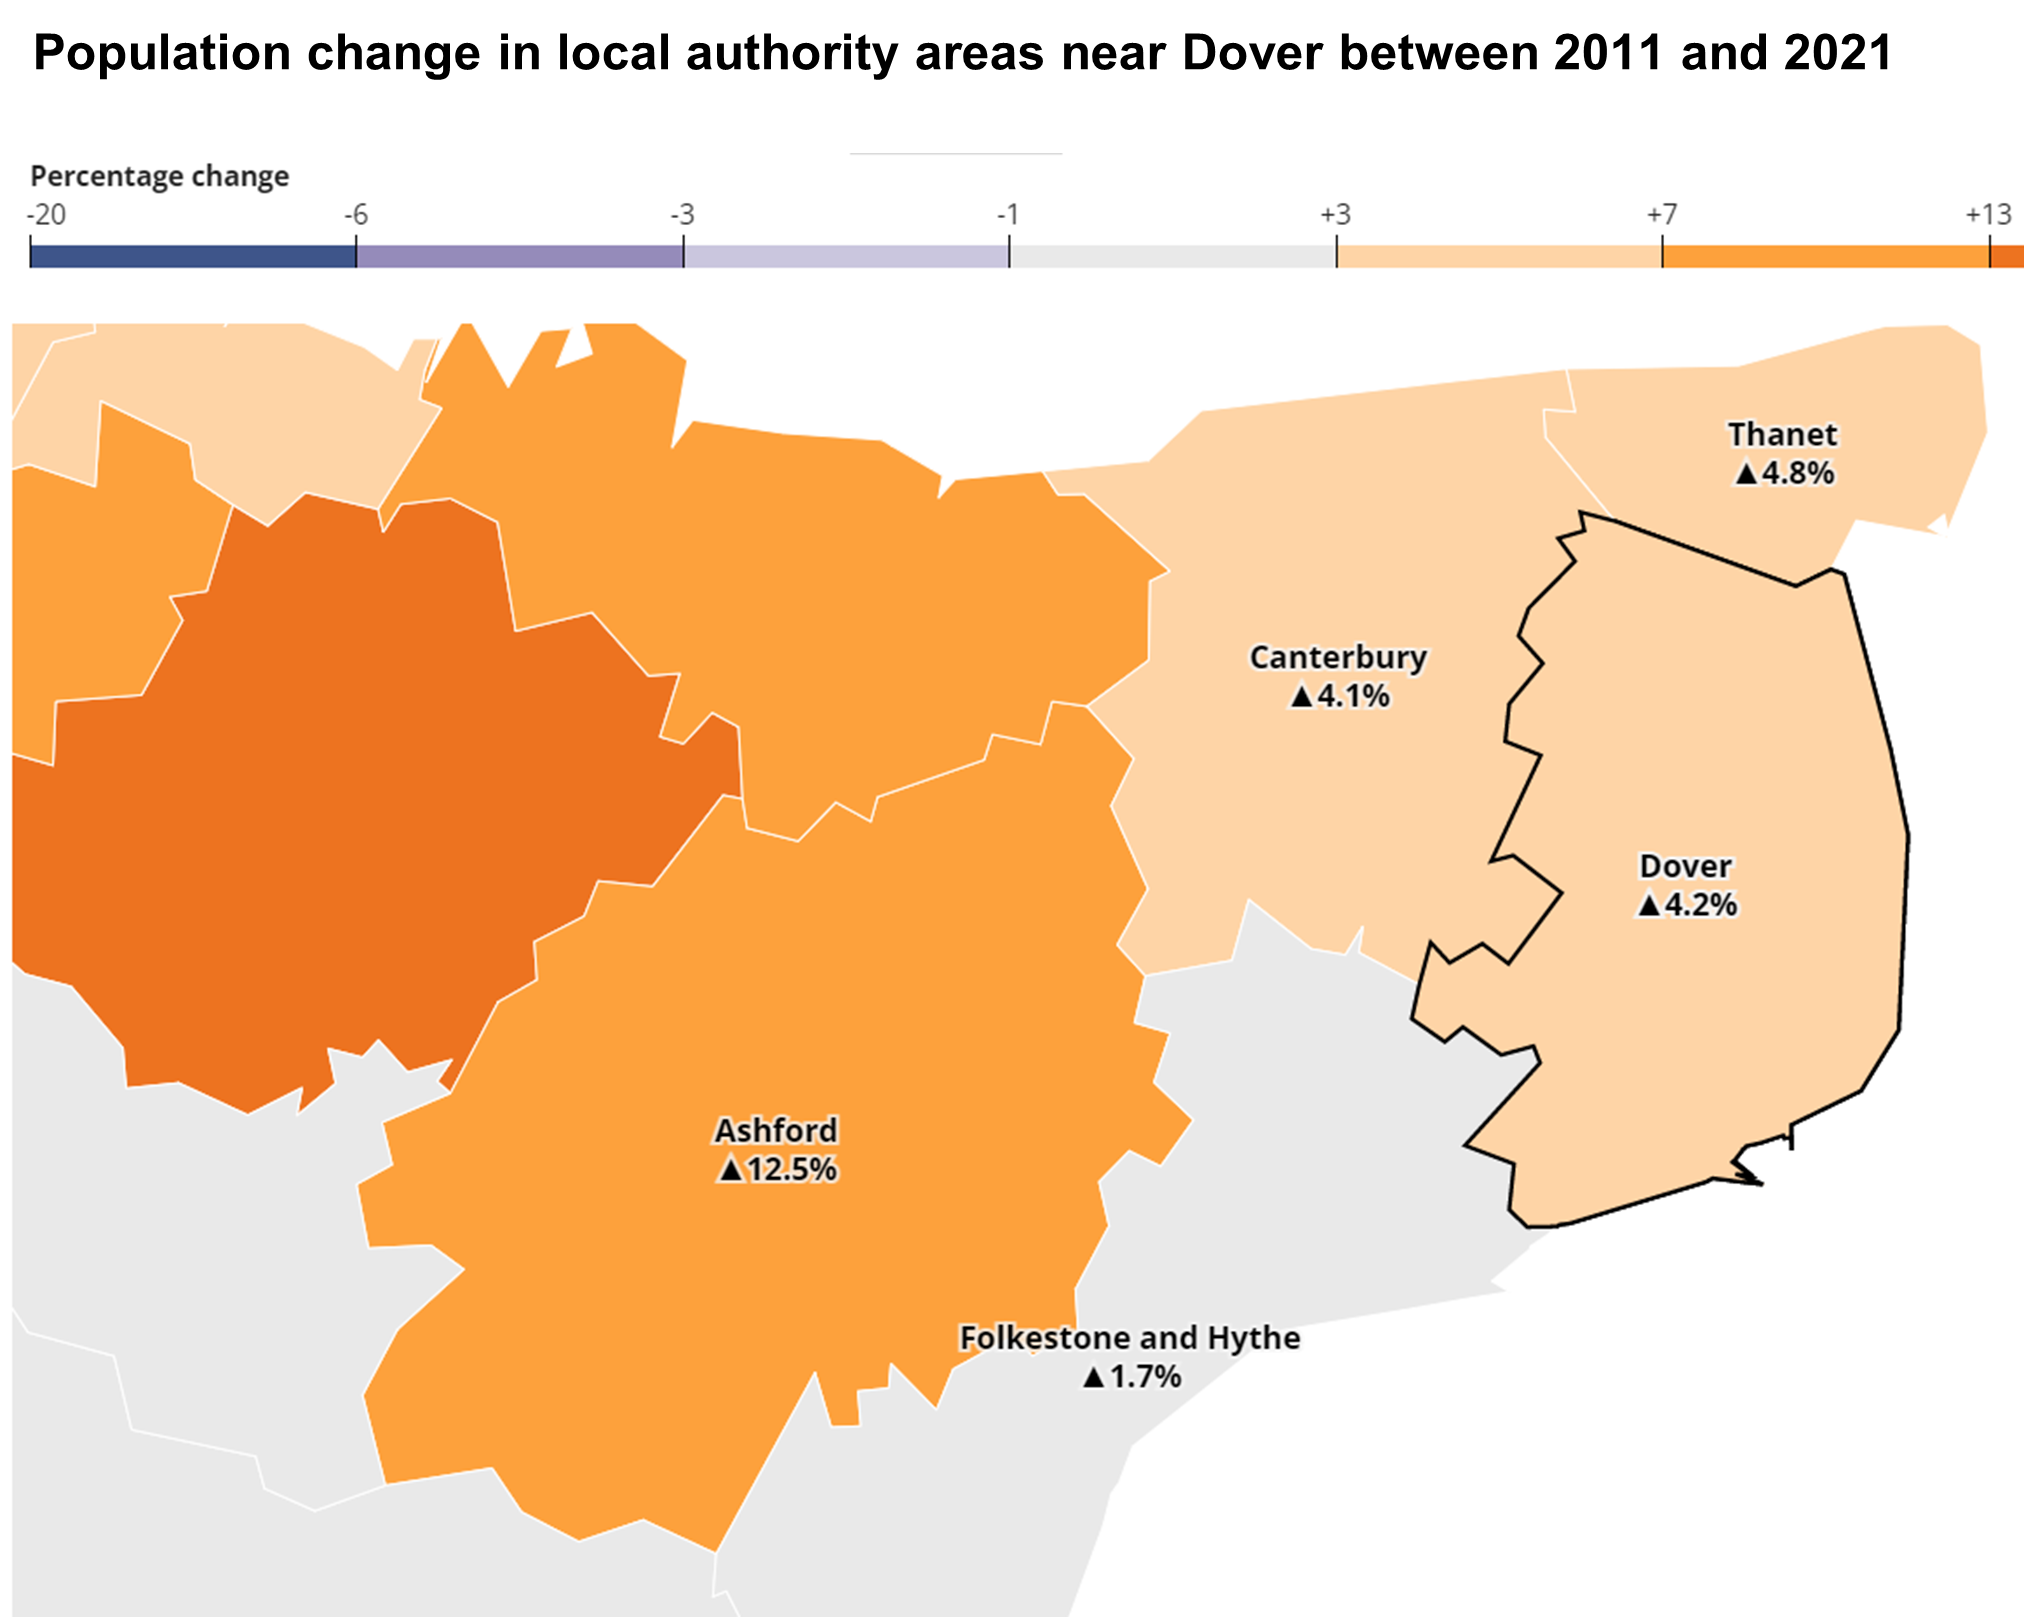
In the Dover District, the population size has increased by +4.2%, from around 111,700 in 2011 to 116,400 in 2021. This is lower than the overall increase for England (+6.6). It is also lower than the growth for the South East (7.5%).
In 2021, the Dover District ranked 206th for total population out of 309 local authority areas in England, which is a fall of five places in a decade (from 201st in 2011).
Nearby areas like Ashford and Thanet have seen their populations increase by around +12.5% and +4.8%, respectively, while others such as Canterbury saw an increase of +4.1% and Folkestone and Hythe saw smaller growth of +1.7%.
The largest population increases in the South East have been seen in Dartford and Milton Keynes, where the populations have grown by +20.0% and +15.3%, respectively. At the other end of the scale, Gosport has seen a fall of -0.9%.
Population density
As of Census 2021, the Dover District is the 23rd least densely populated of the South East's 64 local authority areas. The Dover District has a density (number of usual residents per square kilomentre) of 354, which is equivalent to around three people for every football pitch-sized piece of land.
In comparison, the London Borough of Tower Hamlets is the most densely populated area in England (density of 12,852 residents per square kilomentre), equivalent of around 112 people per pitch. Whilst the least densely populated area in England is Eden in Cumbria (density 25 residents per square kilomentre), which works out at around five pitches per resident.
Population changes by age group
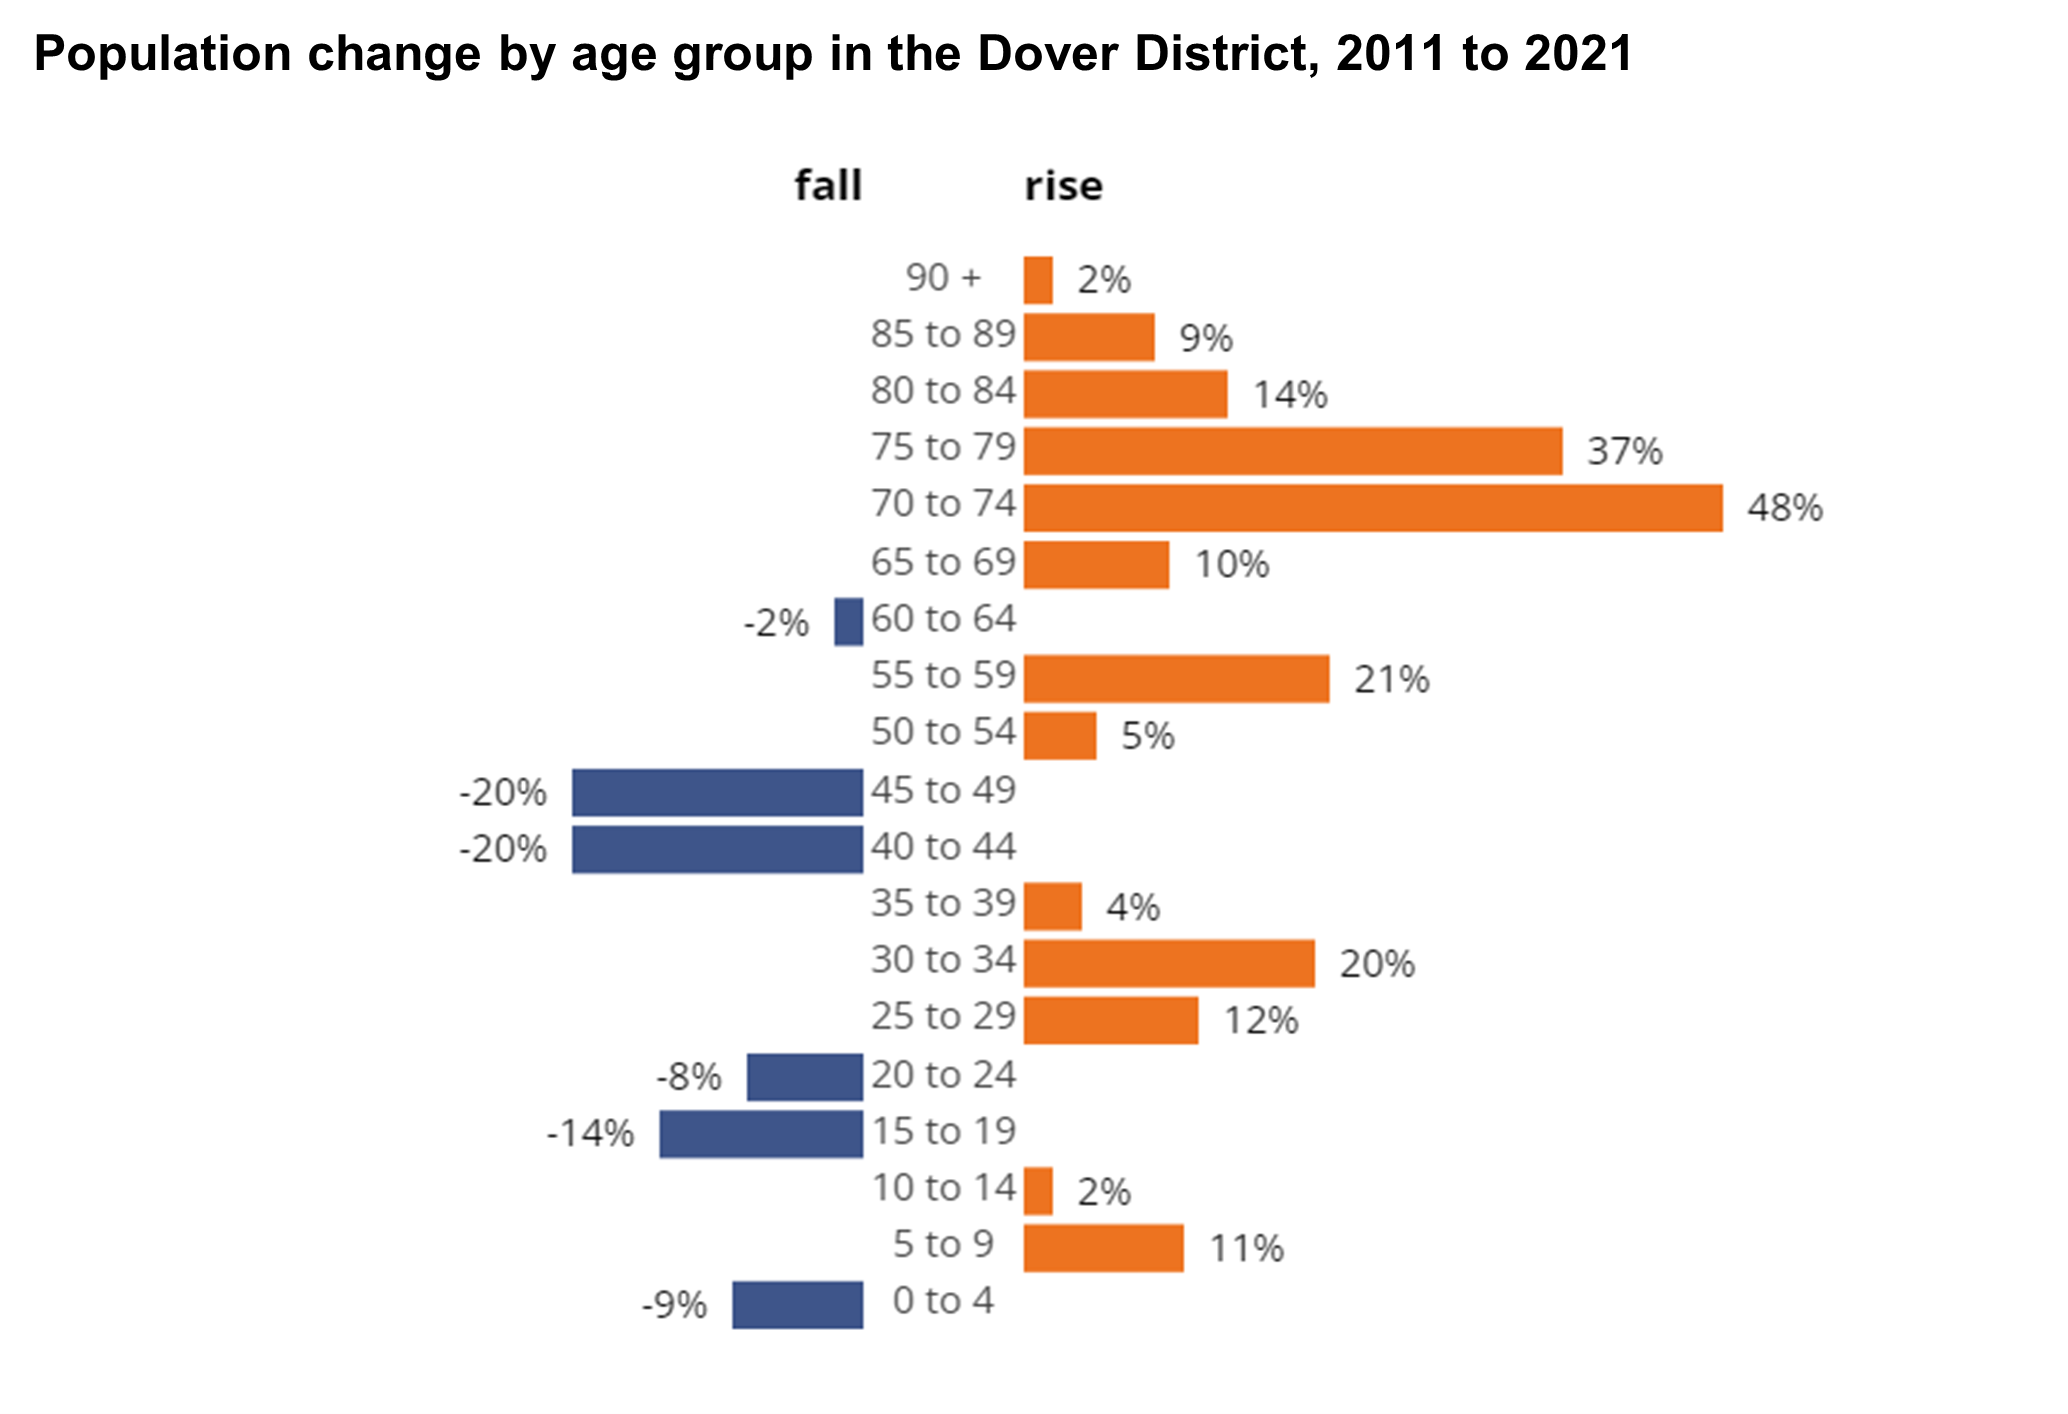
The population of the Dover District is ageing.
In the Dover District, there has been an increase of +23.9% in people aged 65 years and over, a decrease of -1.2% in people aged 15 to 64 years, and an increase of +1.1% in children aged under 15 years.
This compares to an overall increase, in England, of +20.1% in people aged 65 years and over, +3.6% in people aged 15 to 64 years, and +5.0% in children aged under 15 years.
Notes
- Source: Office for National Statistics licensed under the Open Government Licence v1.0.
- Population change in certain areas may reflect how the coronavirus (COVID-19) pandemic affected people's choice of usual residence on Census Day, for example, students and in some urban areas.
- These changes might have been temporary for some areas and more long-lasting for others.
- First results from Census 2021 are rounded to the nearest one hundred so may not add exactly.
Definitions
- Usual Resident Population: For the 2021 Census, a usual resident of the UK is anyone who, on census day 2021, was in the UK and had stayed or intended to stay in the UK for a period of 12 months or more, or had a permanent UK address and was outside the UK and intended to be outside the UK for less than 12 months.
- Population by age: The age of a person is derived from their date of birth. It is their age in years on their last birthday up to and including census day 2021.
- Occupied households: The number of households with at least one usual resident. A household is defined as one person living alone, or a group of people (not necessarily related) living at the same address who share cooking facilities and share a living room, sitting room or dining area.
Related links
Our Census 2021 Home Page.