We are redesigning our website to make it easier for you to access our services online.
This is happening in phases so you'll start to notice some parts of the website looking different.
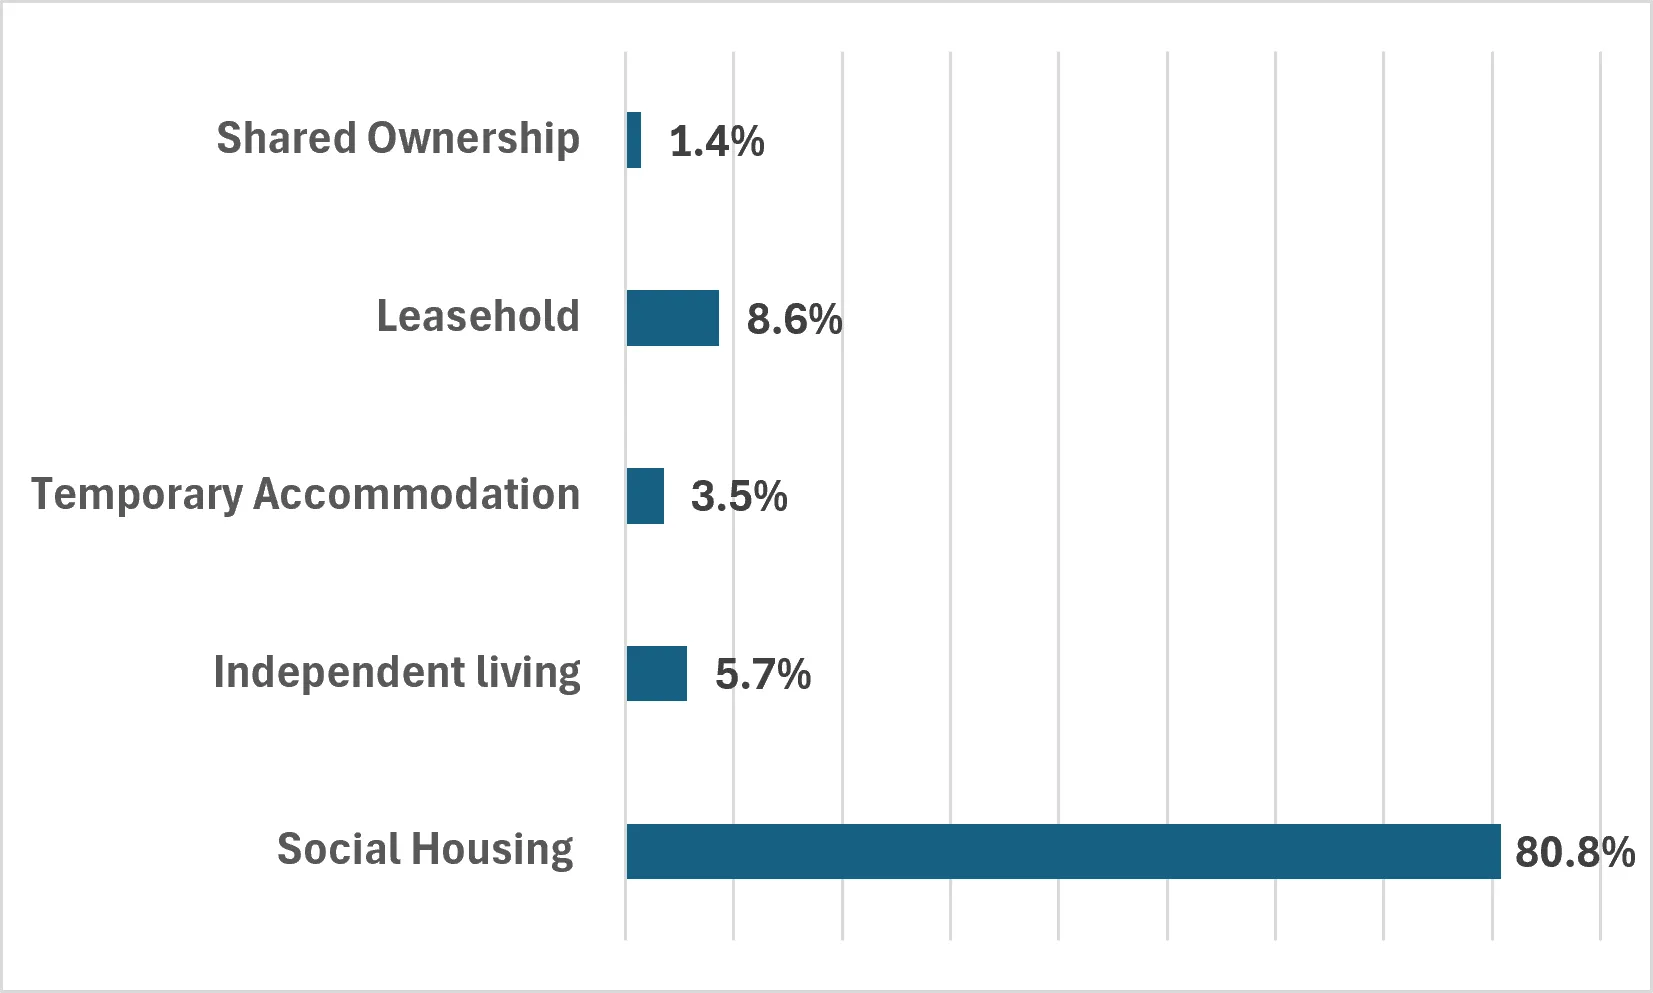
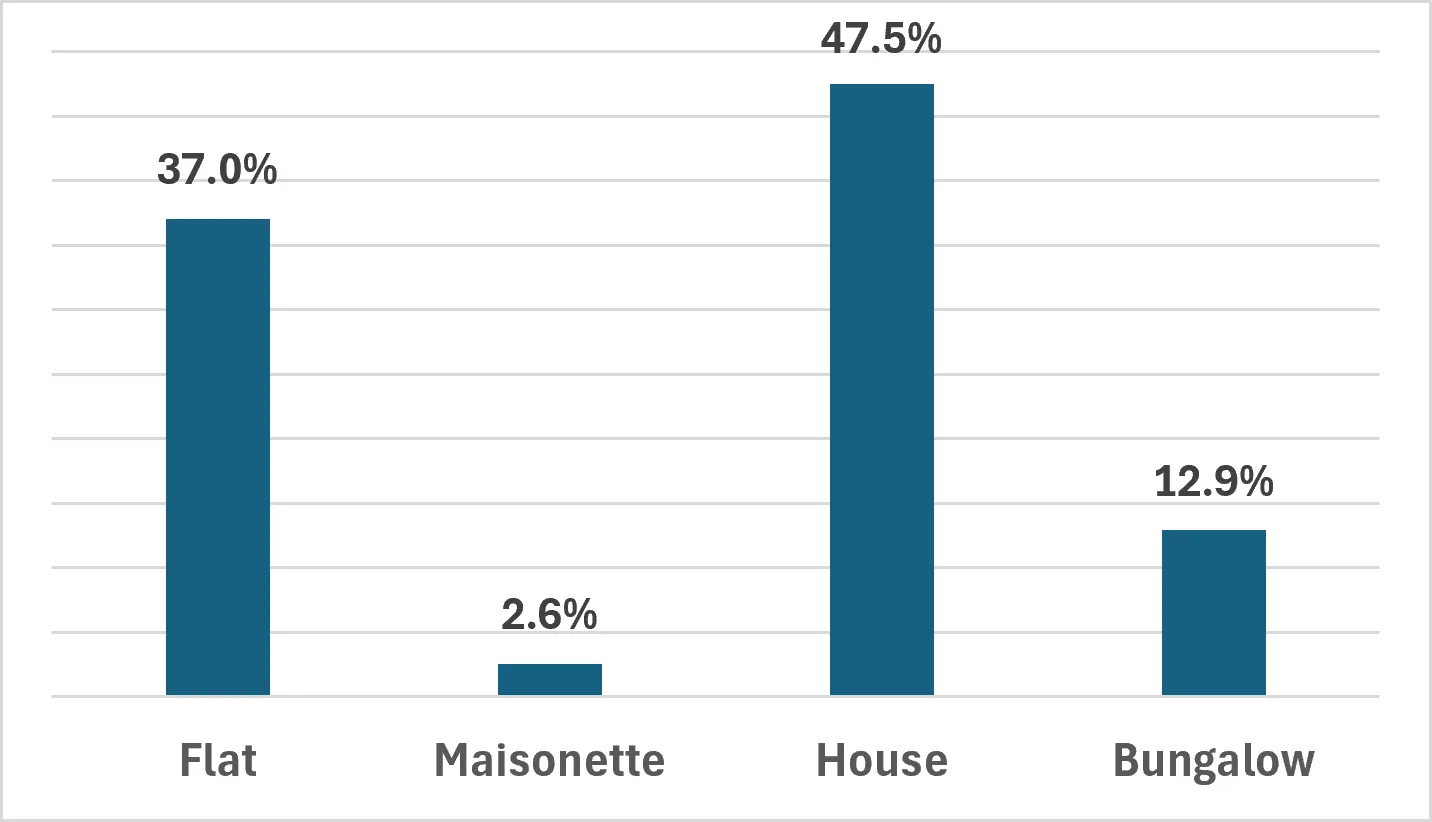
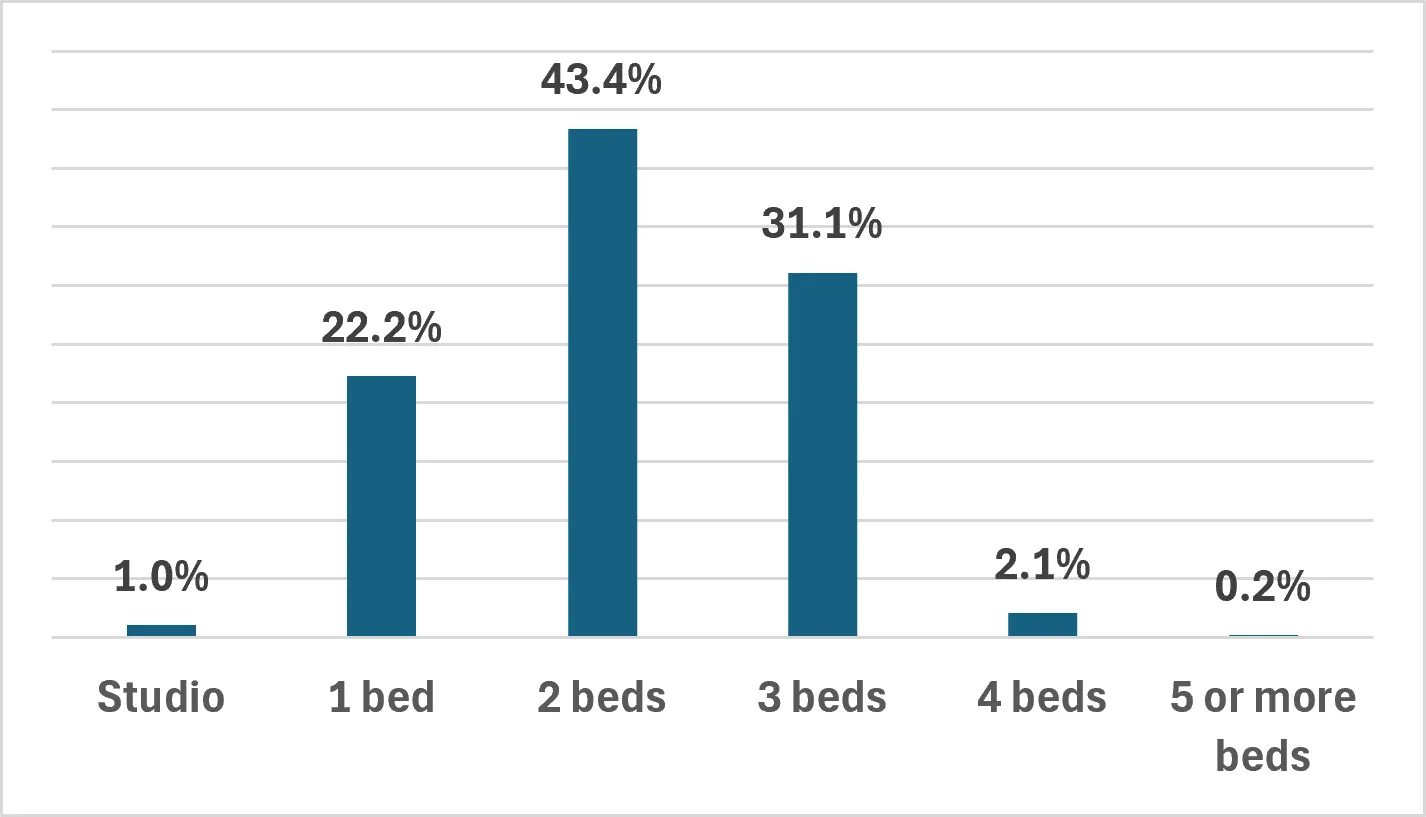
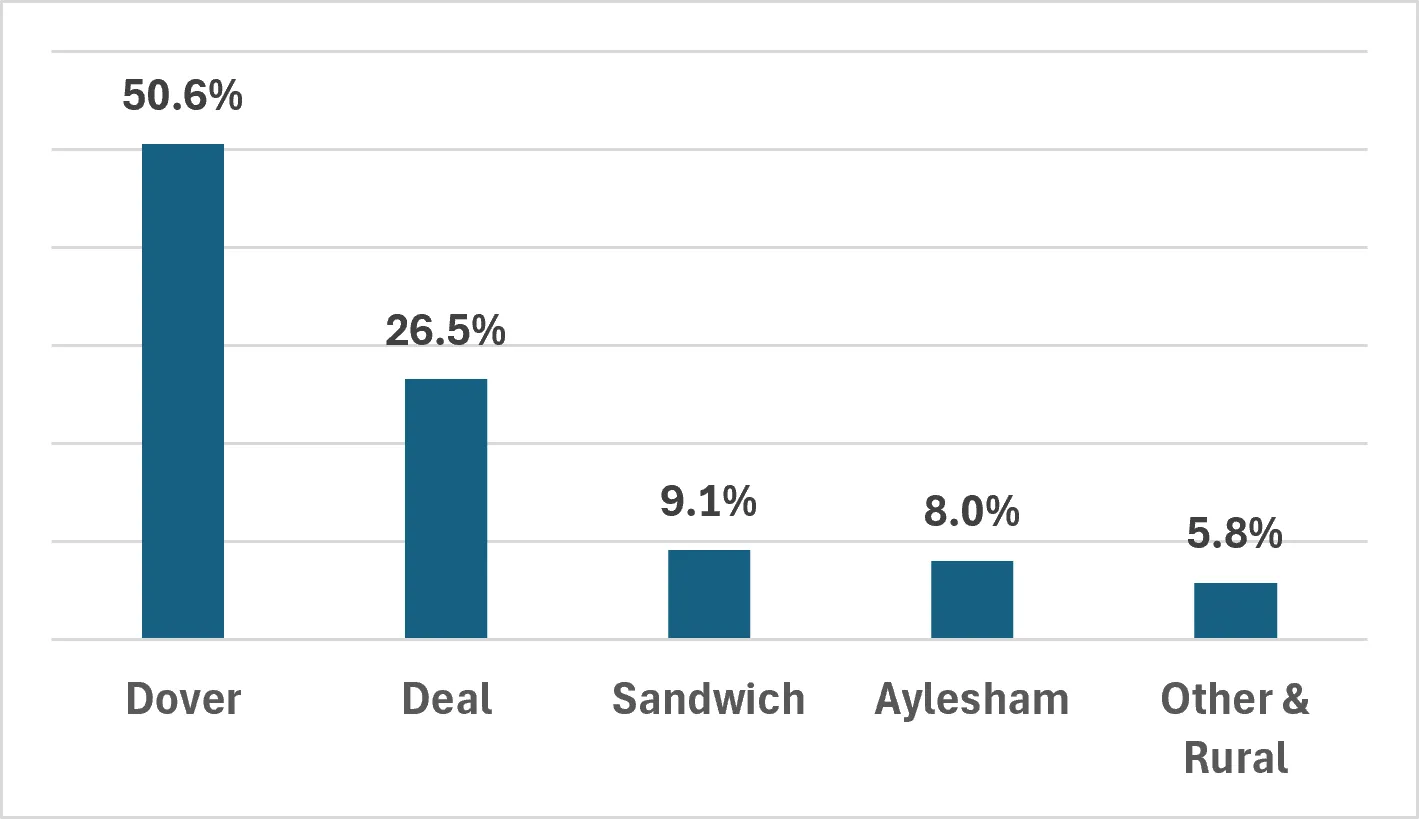
We manage a diverse housing portfolio of around 5,000 homes, including social rented homes, temporary accommodation and shared ownership. The graphs below provide an overview of how our housing portfolio is made up.
We aim to review and update the information on this page every quarter.
Types of housing
Social housing is provided by councils or housing associations and is charged at either social or affordable rent. It's designed for people who cannot afford private rents or who need secure, long-term housing. Rents are lower than private rents and tenancies offer more stability.
Independent living is a type of social housing for older adults or those with support needs, who want to live independently in their own homes but with some support available.
Council-owned temporary accommodationis short-term housing provided by us when an individual or household becomes homeless. The accommodation is granted temporarily while we work with the household to find a more permanent home.
Leaseholdproperties refer to ex-council flats that have been bought by tenants through the Right to Buy. This scheme allows eligible tenants to purchase their home at a discount, turning them from a renting tenant into a leaseholder.
Shared ownership is a government-backed affordable homeownership scheme that lets eligible buyers purchase a share of a home (usually between 10-75%) and pay rent on the unsold share to the council or housing association.
The scheme is designed to make homeownership more affordable. Over time, shared owners can by more shares (called 'staircasing') until they own the property outright, however some schemes prevent outright ownership due to planning restrictions.