Key Findings for the Dover District
The English Indices of Deprivation 2019 reinforce previously identified patterns of deprivation across the district.
The district continues to have deprivation ‘hot spots’ that are amongst some of the most deprived small areas in the country yet are geographically close to some of the least deprived areas in the country.
Using the Rank of Average Score summary measure (please see our Deprivation Home Page for further information on the national summery measures), when compared with other local authority districts in Kent and England as a whole, the Dover district is in England’s most deprived half of local authorities.
- National rank: 113 (out of 317 English local authority districts, where 1 is the most deprived)
- Kent rank: 4 (out of 12 Kent local authority districts, where 1 is the most deprived)
- Number of Lower-layer Super Output Areas (LSOAs) in the most deprived 10% nationally: 05 (out of 67 LSOAs in the district)
- Number of Lower-layer Super Output Areas (LSOAs) in the most deprived 20% nationally: 12 (out of 67 LSOAs in the district)
- Number of Lower-layer Super Output Areas (LSOAs) in the least deprived 10% nationally: 01 (out of 67 LSOAs in the district)
- The highest levels of multiple deprivation are found in the urban areas of Dover
Dover District Rankings
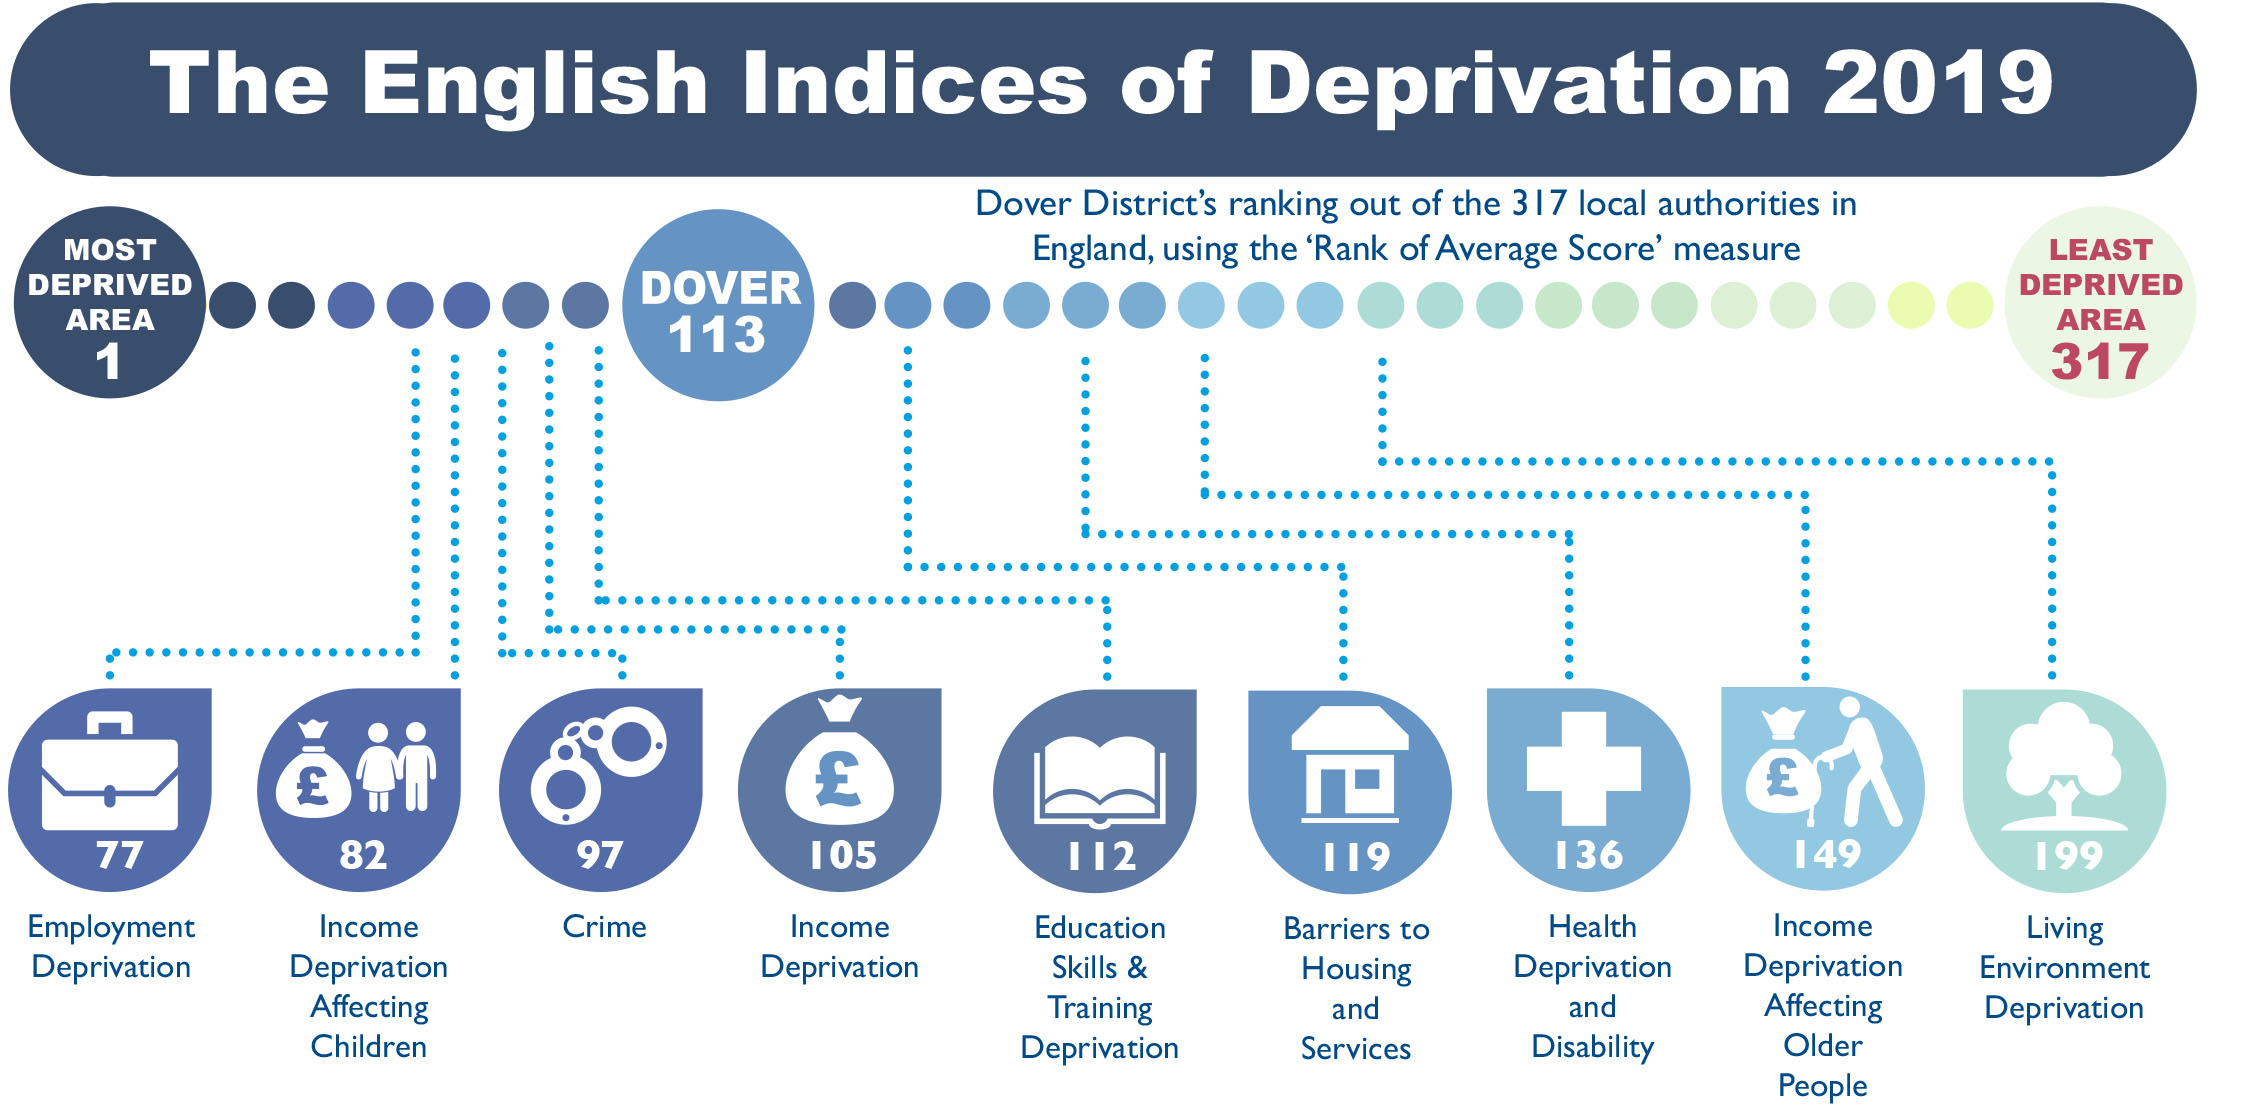
In the Indices of Deprivation 2019, the Dover District’s national rankings, out of 317 local authority districts, using the ‘Rank of Average Score’ measure, are as follows:
- Index of Multiple Deprivation: 113th
- Employment deprivation: 77th
- Income deprivation affecting children: 82nd
- Crime: 97th
- Income deprivation: 105th
- Education, skills and training: 112th
- Barriers to housing and services: 119th
- Health deprivation and disability: 136th
- Income deprivation affecting older people: 149th
- Living environment deprivation: 199th
Dover District Lower-layer Super Output Areas (LSOAs)
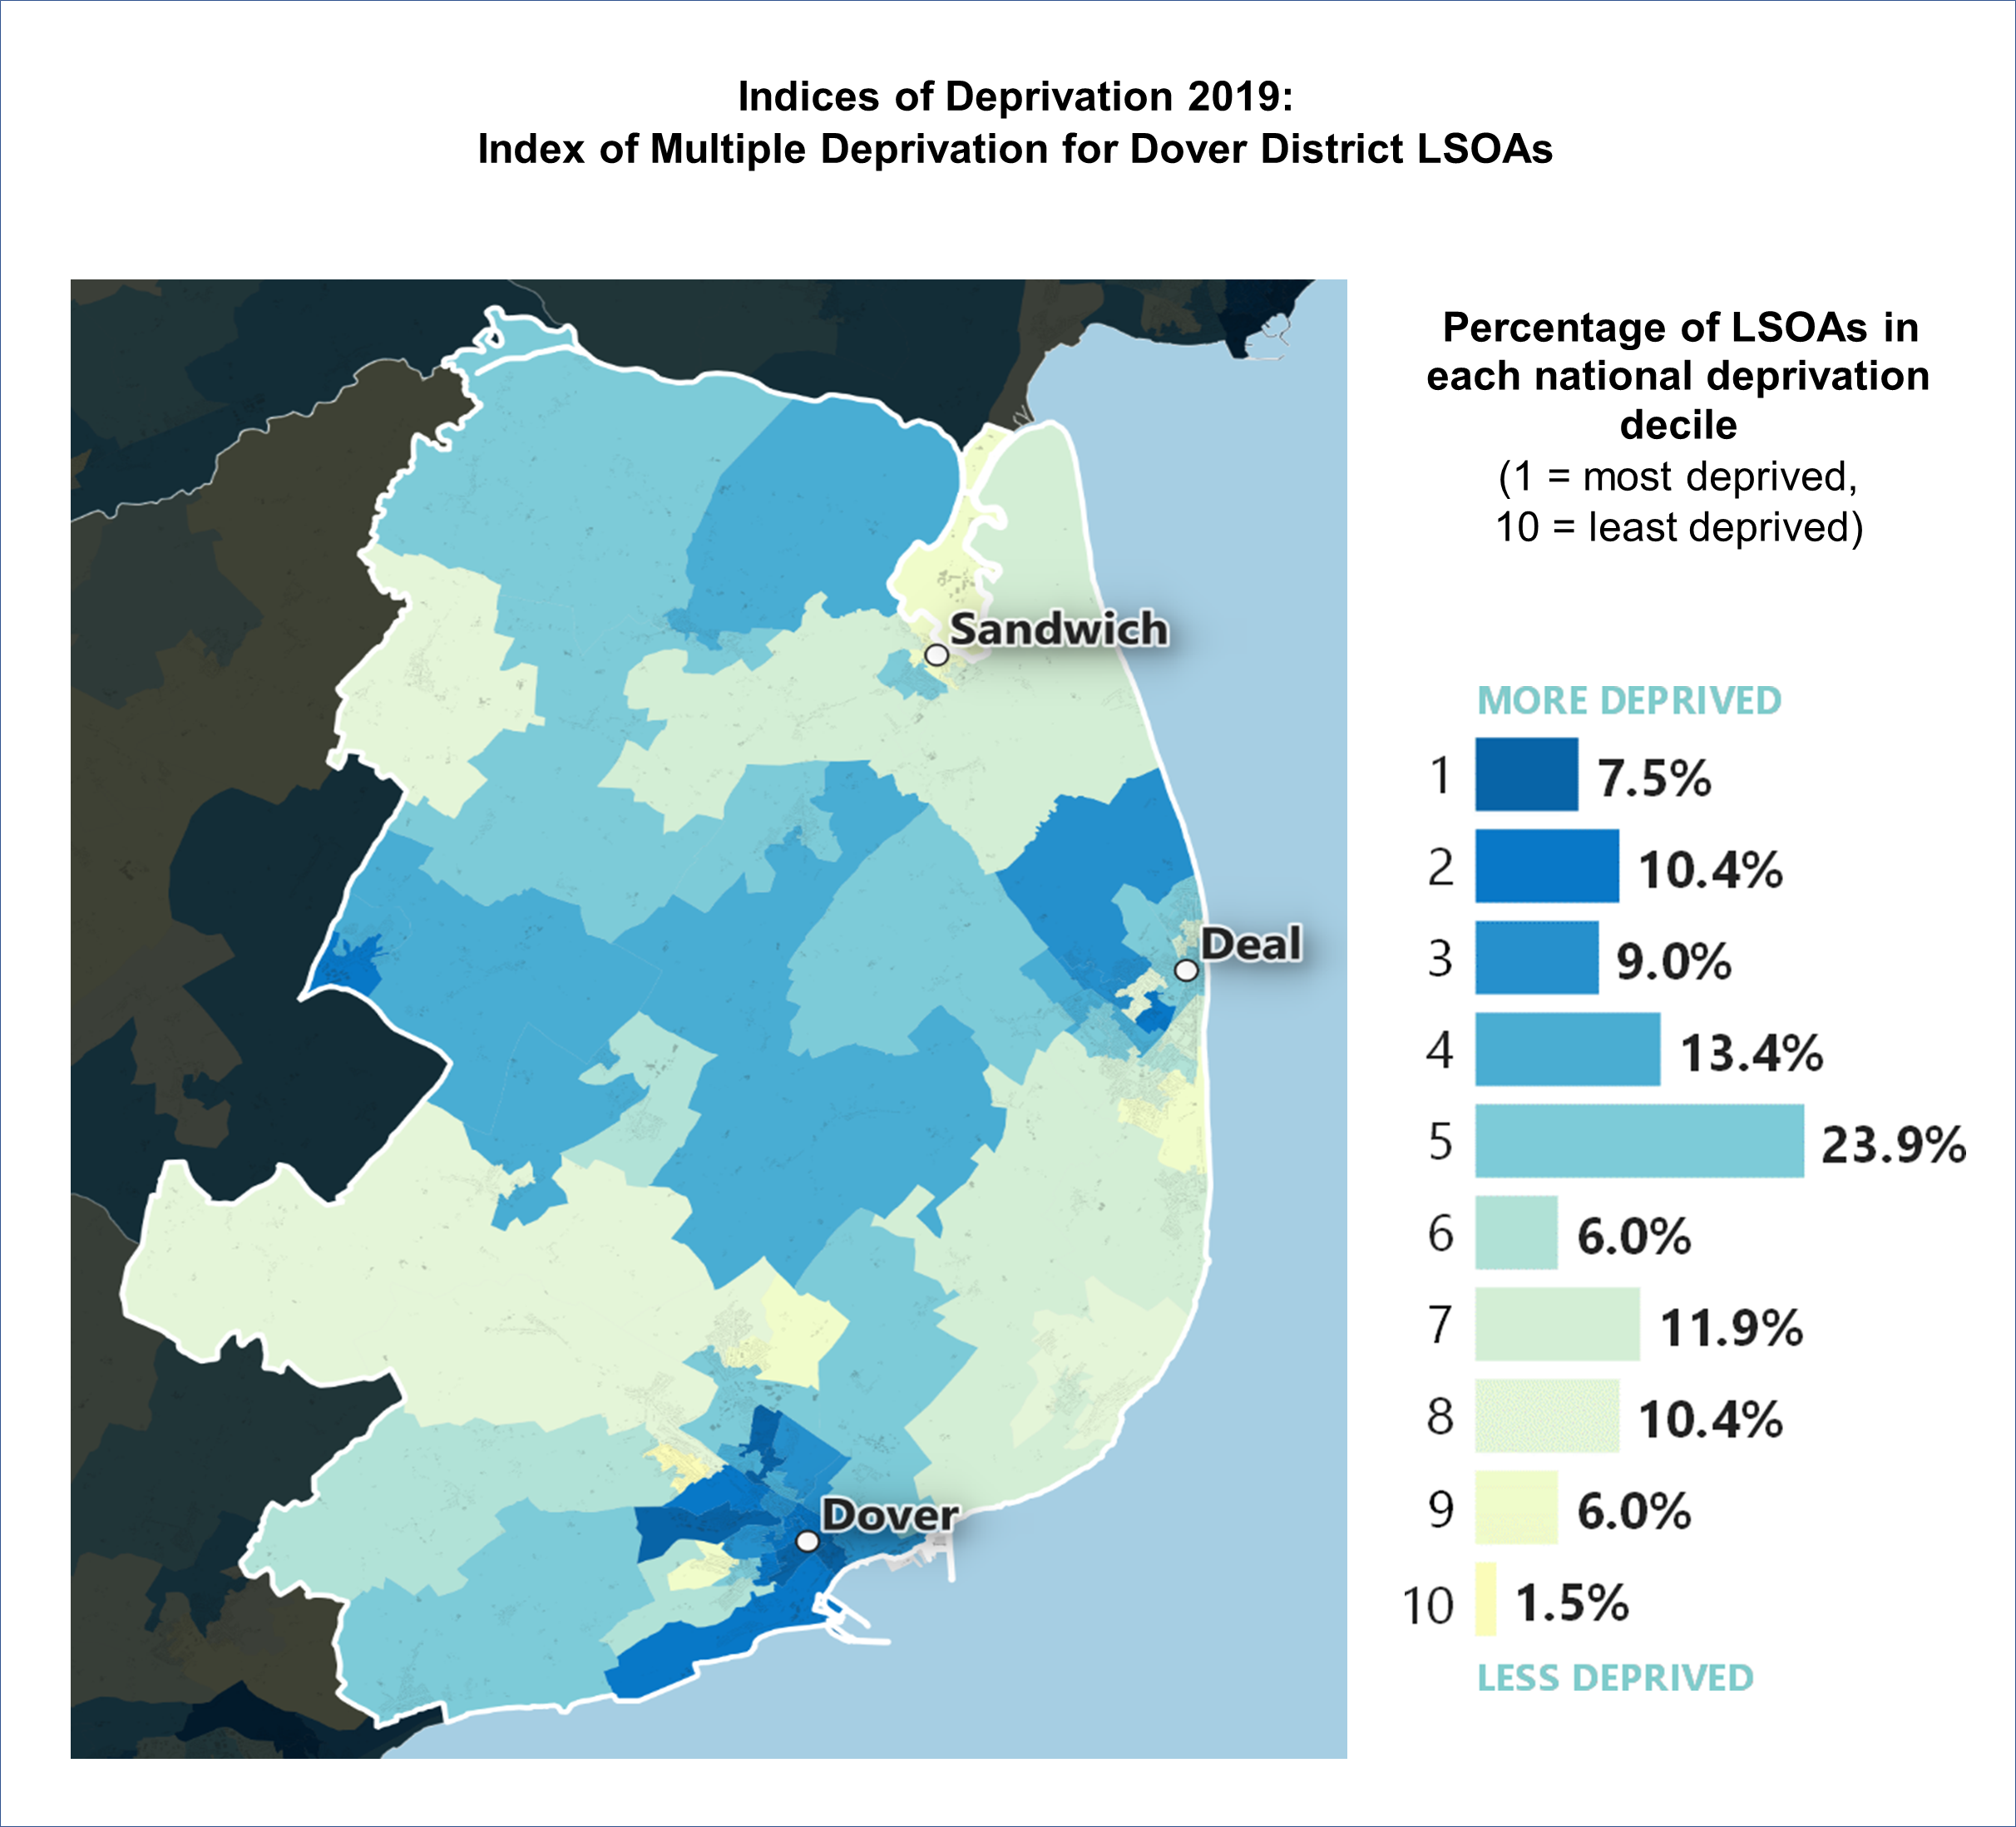 Source: Indices of Deprivation 2019 local authority maps. Maps produced by the Government use shading that gradually changes from dark blue (most deprived 10% of LSOAs in England) to yellow (least 10% deprived of LSOAs in England).
Percentage and number of LSOAs in the district in each deprivation decile
- Decile 1: Most deprived 10%: 7.5% or 5 LSOAs
- Decile 2: 10.4% or 7 LSOAs
- Decile 3: 9.0% or 6 LSOAs
- Decile 4: 13.4% or 9 LSOAs
- Decile 5: 23.9% or 16 LSOAs
- Decile 6: 6.0% or 4 LSOAs
- Decile 7: 11.9% or 8 LSOAs
- Decile 8: 10.4% or 7 LSOAs
- Decile 9: 6.0% or 4 LSOAs
- Decile 10 Least deprived 10%: 1.5% or 1 LSOA
The most and least deprived areas in the district
LSOAs do not have descriptive place names and are therefore difficult to relate to. Therefore, we have identified which ward the LSOAs fall within. Maps of the LSOAs are available on request.
The highest levels of multiple deprivation are found in the urban areas of Dover.
Five LSOAs in the district are ranked in the most deprived decile of local authority districts in England i.e. the 10% most deprived areas. These LSOAs fall within the wards of St. Radigunds (one LSOA), Town and Castle (two LSOAs), and Buckland (two LSOAs).
The LSOA that falls within the St. Radigunds ward is also in the top 5% most deprived areas in the country.
A further seven LSOAs fall into the second decile (10-20%) most deprived areas in England.
There is one LSOA in the District, within the Dover Downs and River ward, that falls into the least deprived 10% in the country.
Around 7,815 residents in the district live in a neighbourhood identified as one of the 10% most deprived in England, including 1,793 children (aged 0-15 years) and 1,500 older people (aged 60+ years). However, it is important to note that not all people living in a deprived area will be deprived and, similarly, not all deprived people live in deprived areas.
Top and Bottom Ten LSOAs in the Dover District
The following table below shows the most and the least deprived neighbourhoods in the Dover District, according to the Index of Multiple Deprivation 2019. The National Rank is out of 32,844 LSOAs. The DDC rank is out of 67 LSOAS. A list of the ranks for all 67 LSOAs in the Dover District is available on request.
Top and Bottom Ten: The most and least deprived LSOAs in the Dover District
| LSOA Code | Ward this area falls within | National Rank of IMD score | IMD national decile | DDC Rank |
|---|
| E01024240 |
St, Radigunds |
994 |
1 |
1 |
| E01024215 |
Town and Castle |
2,105 |
1 |
2 |
| E01024193 |
Buckland |
2,450 |
1 |
3 |
| E01033211 |
Town and Castle |
2,473 |
1 |
4 |
| E01024196 |
Buckland |
2,545 |
1 |
5 |
| E01024214 |
Town and Castle |
3,655 |
2 |
6 |
| E01024192 |
Aylesham, Eythorne and Shepherdswell |
4,622 |
2 |
7 |
| E01024249 |
Town and Castle |
4,692 |
2 |
8 |
| E01024246 |
Tower Hamlets |
4,790 |
2 |
9 |
| E01024247 |
St. Radigunds |
4,906 |
2 |
10 |
| E01024255 |
Whitfield |
25,052 |
8 |
58 |
| E01033210 |
Dover Downs and River |
25,461 |
8 |
59 |
| E01024237 |
Guston, Kingsdown and St. Margarets-at-Cliffe |
25,571 |
8 |
60 |
| E01024235 |
Dover Downs and River |
25,830 |
8 |
61 |
| E01024221 |
Middle Deal |
26,064 |
8 |
62 |
| E01024256 |
Whitfield |
26,346 |
9 |
63 |
| E01024253 |
Walmer |
26,541 |
9 |
64 |
| E01024213 |
Maxton and Elms Vale |
27,955 |
9 |
65 |
| E01024244 |
Sandwich |
28,240 |
9 |
66 |
| E01024233 |
Dover Downs and River |
31,698 |
10 |
67 |
Deprivation Domains
Income Deprivation
This domain measures the proportion of the population experiencing deprivation relating to low income. This includes both people that are out of work and those that are in work but have low earnings.
In the district, 13.4% of the population (15,110 people) are income deprived.
There are five LSOAs in the top 10% most deprived in England. These fall within the wards of:
- St. Radigunds (40.2% of the population)
- Town and Castle (28.7% of the population)
- Buckland (28.6% of the population)
- Buckland (27.9% of the population)
- Middle Deal (26.9% of the population)
The LSOA within the St. Radigund’s ward is in the top 5% most deprived areas in the country.
Income Deprivation Affecting Children Index
This supplementary index measures the proportion of children aged 0-15 years living in income- deprived families.
In the Dover District, 19.4% of children are living in income-deprived households.
Six LSOAs are in the top 10% most deprived in England. These fall within the wards of:
- St. Radigunds (48.3% of children)
- Town and Castle (41.6% of children)
- Buckland (41.1% of children)
- Middle Deal (37.0% of children)
- Town and Castle (36.9% of children)
- Buckland (33.3% of children)
The top three LSOAs in the above list are within the top 5% most deprived in England.
Income Deprivation Affecting Older People Index
This supplementary index measures proportion of people aged 60 years and over, who experience income deprivation.
In the Dover District, 12.0% of people aged 60 plus years are living in income-deprived households.
There is one LSOA in the district within the top 10% deprived nationally. This falls within the ward of St Radigunds (37.4% of people aged 60 plus years). A further one LSOA is in the top 20% deprived. This is within the ward of Town and Castle (27.2% of people aged 60 plus years).
Employment Deprivation
This domain measures the proportion of the working age population involuntarily excluded from the labour market. This includes people who would like to work but are unable to do so due to unemployment, sickness or disability or caring responsibilities.
In the Dover District, 11.3% of the working age population (6,925 people) are employment deprived.
There are five LSOAs in the top 10% deprived in England. These fall within the wards of:
- St Radigunds (24.9% of the working age population)
- Town and Castle (24.0% of the working age population)
- Buckland (23.3% of the working age population)
- Town and Castle (21.4% of the working age population)
- Buckland (20.7% of the working age population)
The top two LSOAs in the above list are in the top 5% most deprived areas in the country.
Education, Skills and Training Deprivation
This domain measures the lack of attainment and skills in the local population.
There are eight LSOAs in the top 10% deprived in England. These fall within the wards of:
- Aylesham, Eythorne and Shepherdswell
- St Radigunds
- Town and Castle
- Buckland
- Town and Castle
- Tower Hamlets
- Town and Castle
- Buckland
The top three LSOAs in the above list are within the top 5% most deprived in the country.
Health Deprivation and Disability
This domain measures the risk of premature death and the impairment of quality of life through poor physical or mental health.
The Dover District does not have any LSOAs within the top 10% most deprived in England.
Crime
This domain measures the risk of personal and material victimisation at a local level.
There are ten LSOAs in the top 10% most deprived in England. These fall within the wards of:
- St Radigunds
- Buckland
- Town and Castle
- Town and Castle
- St Radigunds
- Tower Hamlets
- St Radigunds
- Town and Castle
- St Radigunds
- Buckland
The top six of the LSOAs in the above list are in the top 5% most deprived in England.
Barriers to Housing and Services
This domain measures the physical and financial accessibility of housing and local series.
There are ten LSOAs in the top 10% deprived in England. These fall within the wards of:
- Eastry Rural
- Little Stour and Ashstone
- Aylesham, Eythorne and Shephedswell
- Dover Downs and River
- Little Stour and Ashstone
- Alkham and Capel-le-Ferne
- Eastry Rural
- Little Stour and Ashstone
- Guston, Kingsdowns and St Margaret’s-at-Cliffe
- Sandwich
The top five LSOAs in the above list are in the top 5% most deprived small areas in England.
Living Environment Deprivation
This domain measures the quality of the local environment.
There are three LSOAs in the top 10% deprived in England. These fall within the wards of:
- Eastry Rural
- Little Stour and Ashstone
- Eastry Rural
Further key findings information
The following information is available on request:
- Comparisons between the IMD rankings for all LSOA’s in the Dover District
- An overview of the rankings for all the LSOAs across the individual domains and supplementary indices
National Summary Measures for the Dover District
Our key findings focus on the Rank of Average Score national summary measure. The district's rankings for all of the national summary measures can be found in the following table.
National Summary Measures: Rankings for the Dover District
| Summary Measure | Rank (where 1 is the most deprived and 317 is the least deprived |
|---|
| Rank of Average Score |
113 |
| Rank of Average Rank |
107 |
| Rank of Proportion of LSOAs in most deprived 10% nationally |
102 |
| Rank of Extent |
116 |
| Rank of Local Concentration |
109 |
| Rank of Income Scale |
144 |
| Rank of Employment Scale |
148 |